

Here we present some interesting findings. More insights can be found in our publications.
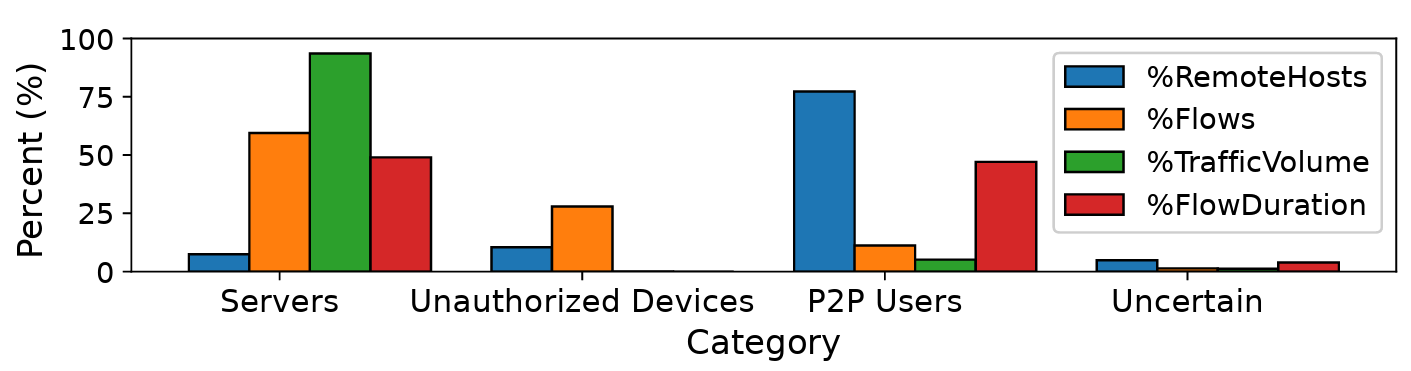
We classify the remote hosts accessed by our users as servers, P2P users, and unauthorized devices. While servers account for 93% of traffic, P2P hosts—77% of remote hosts—contribute only 5% of traffic but 47% of total flow duration, reflecting usage like file sharing and video calls. Unauthorized devices are observed frequently, accounting for many scanning flows.
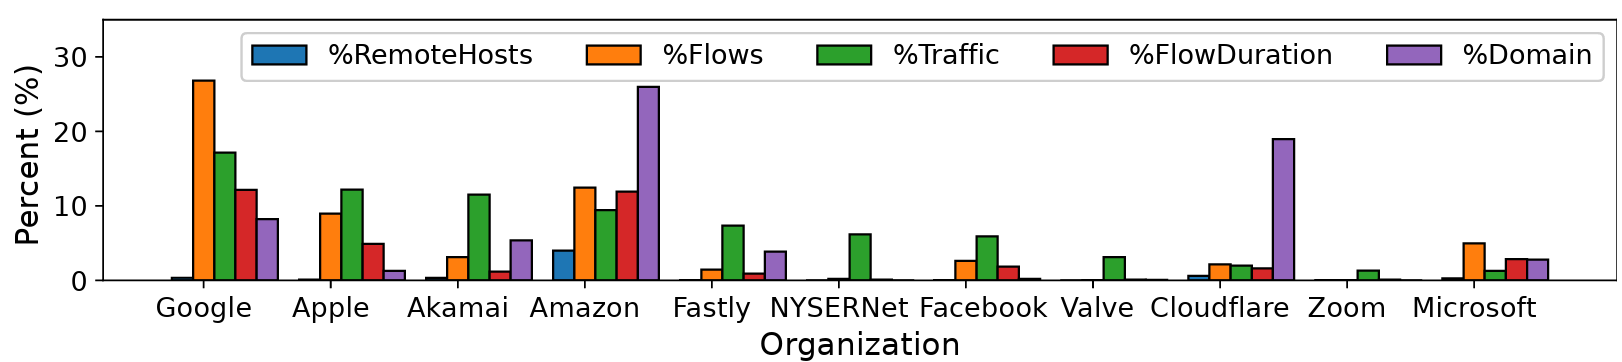
We analyzed which organizations serve traffic to our users and found that a few major providers dominate. While Cloudflare hosts 19% of domains, it only serves 2% of traffic, suggesting those sites are smaller or less frequently visited. In contrast, Google, Amazon, and video-focused CDNs like Akamai and Fastly contribute significantly more traffic volume.
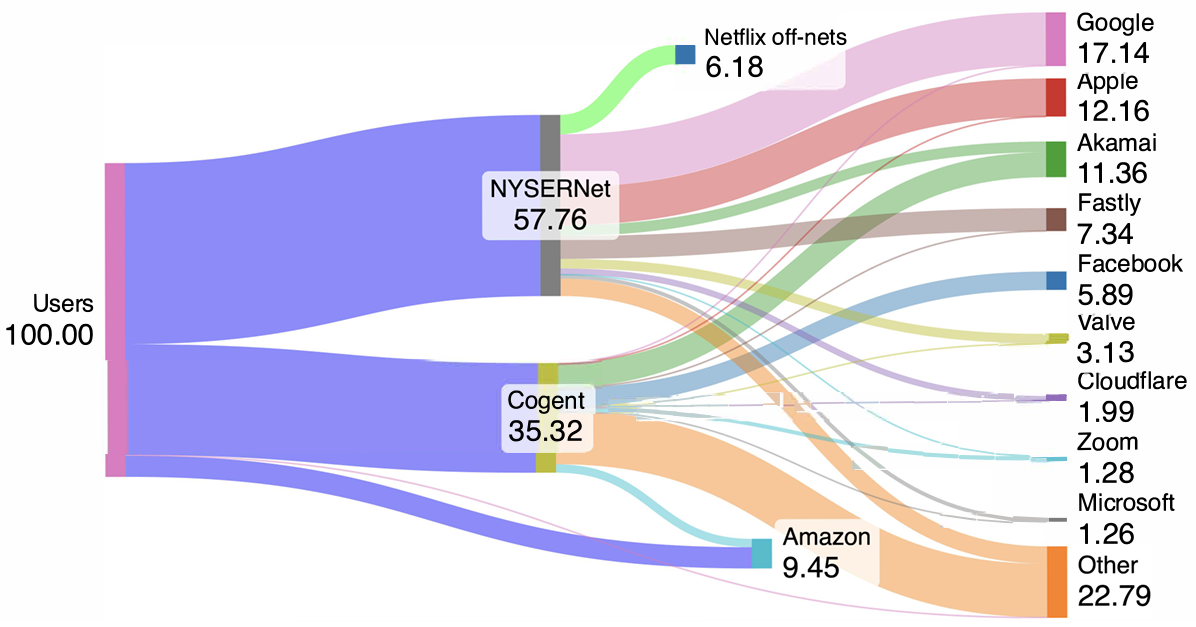
This Sankey diagram also demonstrates how traffic flows from our residential users to major service providers. For better visualization, our Sankey diagram only depicts Columbia providers and the organizations of remote hosts that account for more than 1.2% of traffic. Amazon directly peers with the university and carries 9% of user traffic. Netflix accounts for 6%, served through off-net caches hosted by NYSERNet, a regional research network. All other traffic goes through one of Columbia's providers, with much of it from/to popular clouds, CDNs, and content providers.
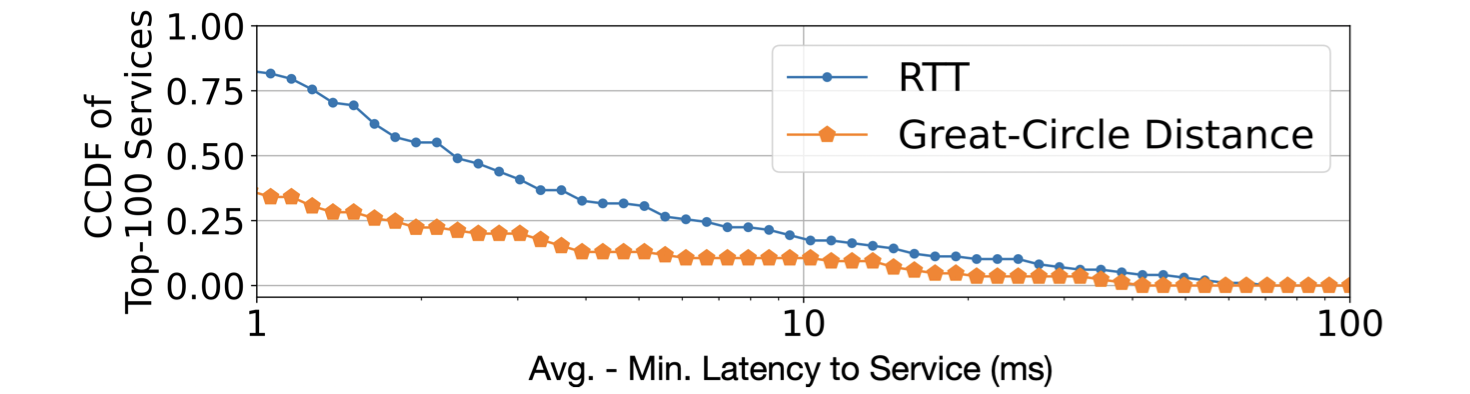
For each of the 100 highest volume services, we calculate the gap between the propagation delay (and distance) to its nearest server and the overall propagation delay (and distance) with each of its servers weighted by the bytes delivered and received. In this figure, we plot the CCDF of services with respect to these gaps. We find that 19% of these services have a latency gap of at least 10 ms; 11% have a distance gap of at least 10ms, meaning that their traffic travels an additional 1000 km each direction on average, compared to the closest remote host. This finding suggests that although deployments are widespread and mappings can be near optimal, a noticeable volume of traffic still flows to/from distant remote hosts. These examples indicate that the services may prioritize other measures over serving users locally or be limited by other factors.
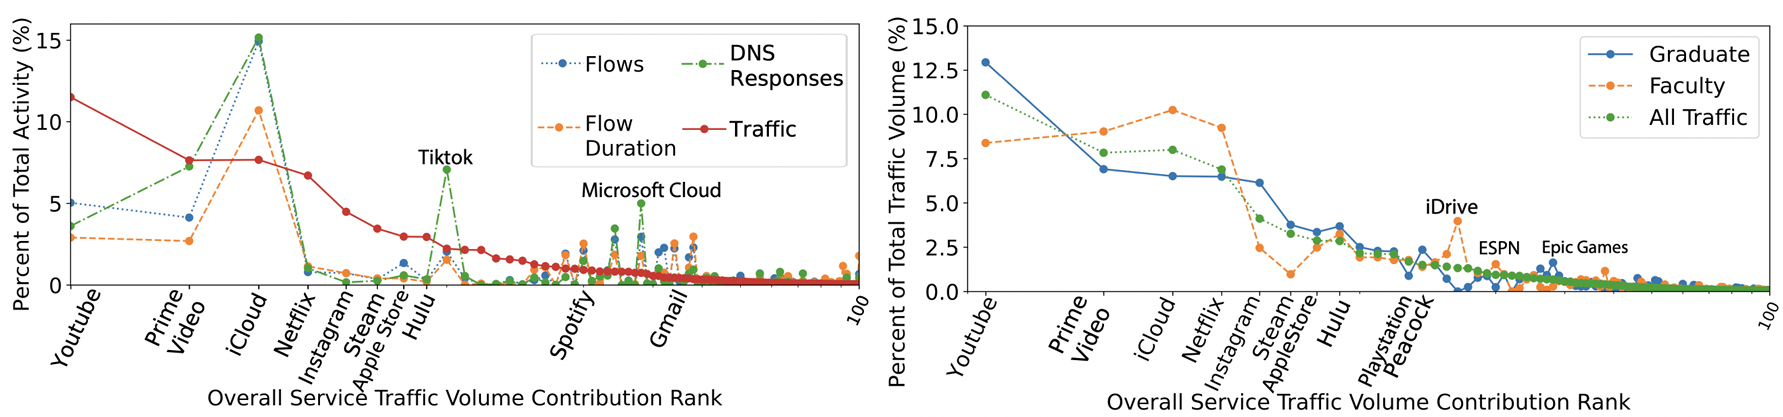
We evaluate service popularity using four metrics: traffic volume, flow count, flow duration, and DNS activity. These metrics often highlight different top services—for instance, iCloud generates less traffic than YouTube but has three times the flow duration. We also find notable usage differences between resident types: graduate students favor YouTube, Hulu, and Instagram, while faculty and families use more Netflix, iCloud, and Playstation. These patterns show that service usage varies both by measurement method and user demographic, even within a single university community.